Microscopy on Demand: Improved display of microscopic conflicts
This year, we have greatly improved the functionalities for displaying microscopic information in MoD (Microscopy on Demand). This was mainly achieved by enhancements to the topology viewer. The topology viewer is a GUI component in Viriato-MoD that can be used to display the microscopic track topology in the macroscopic client. The information for this is provided via a specific microscopic service.
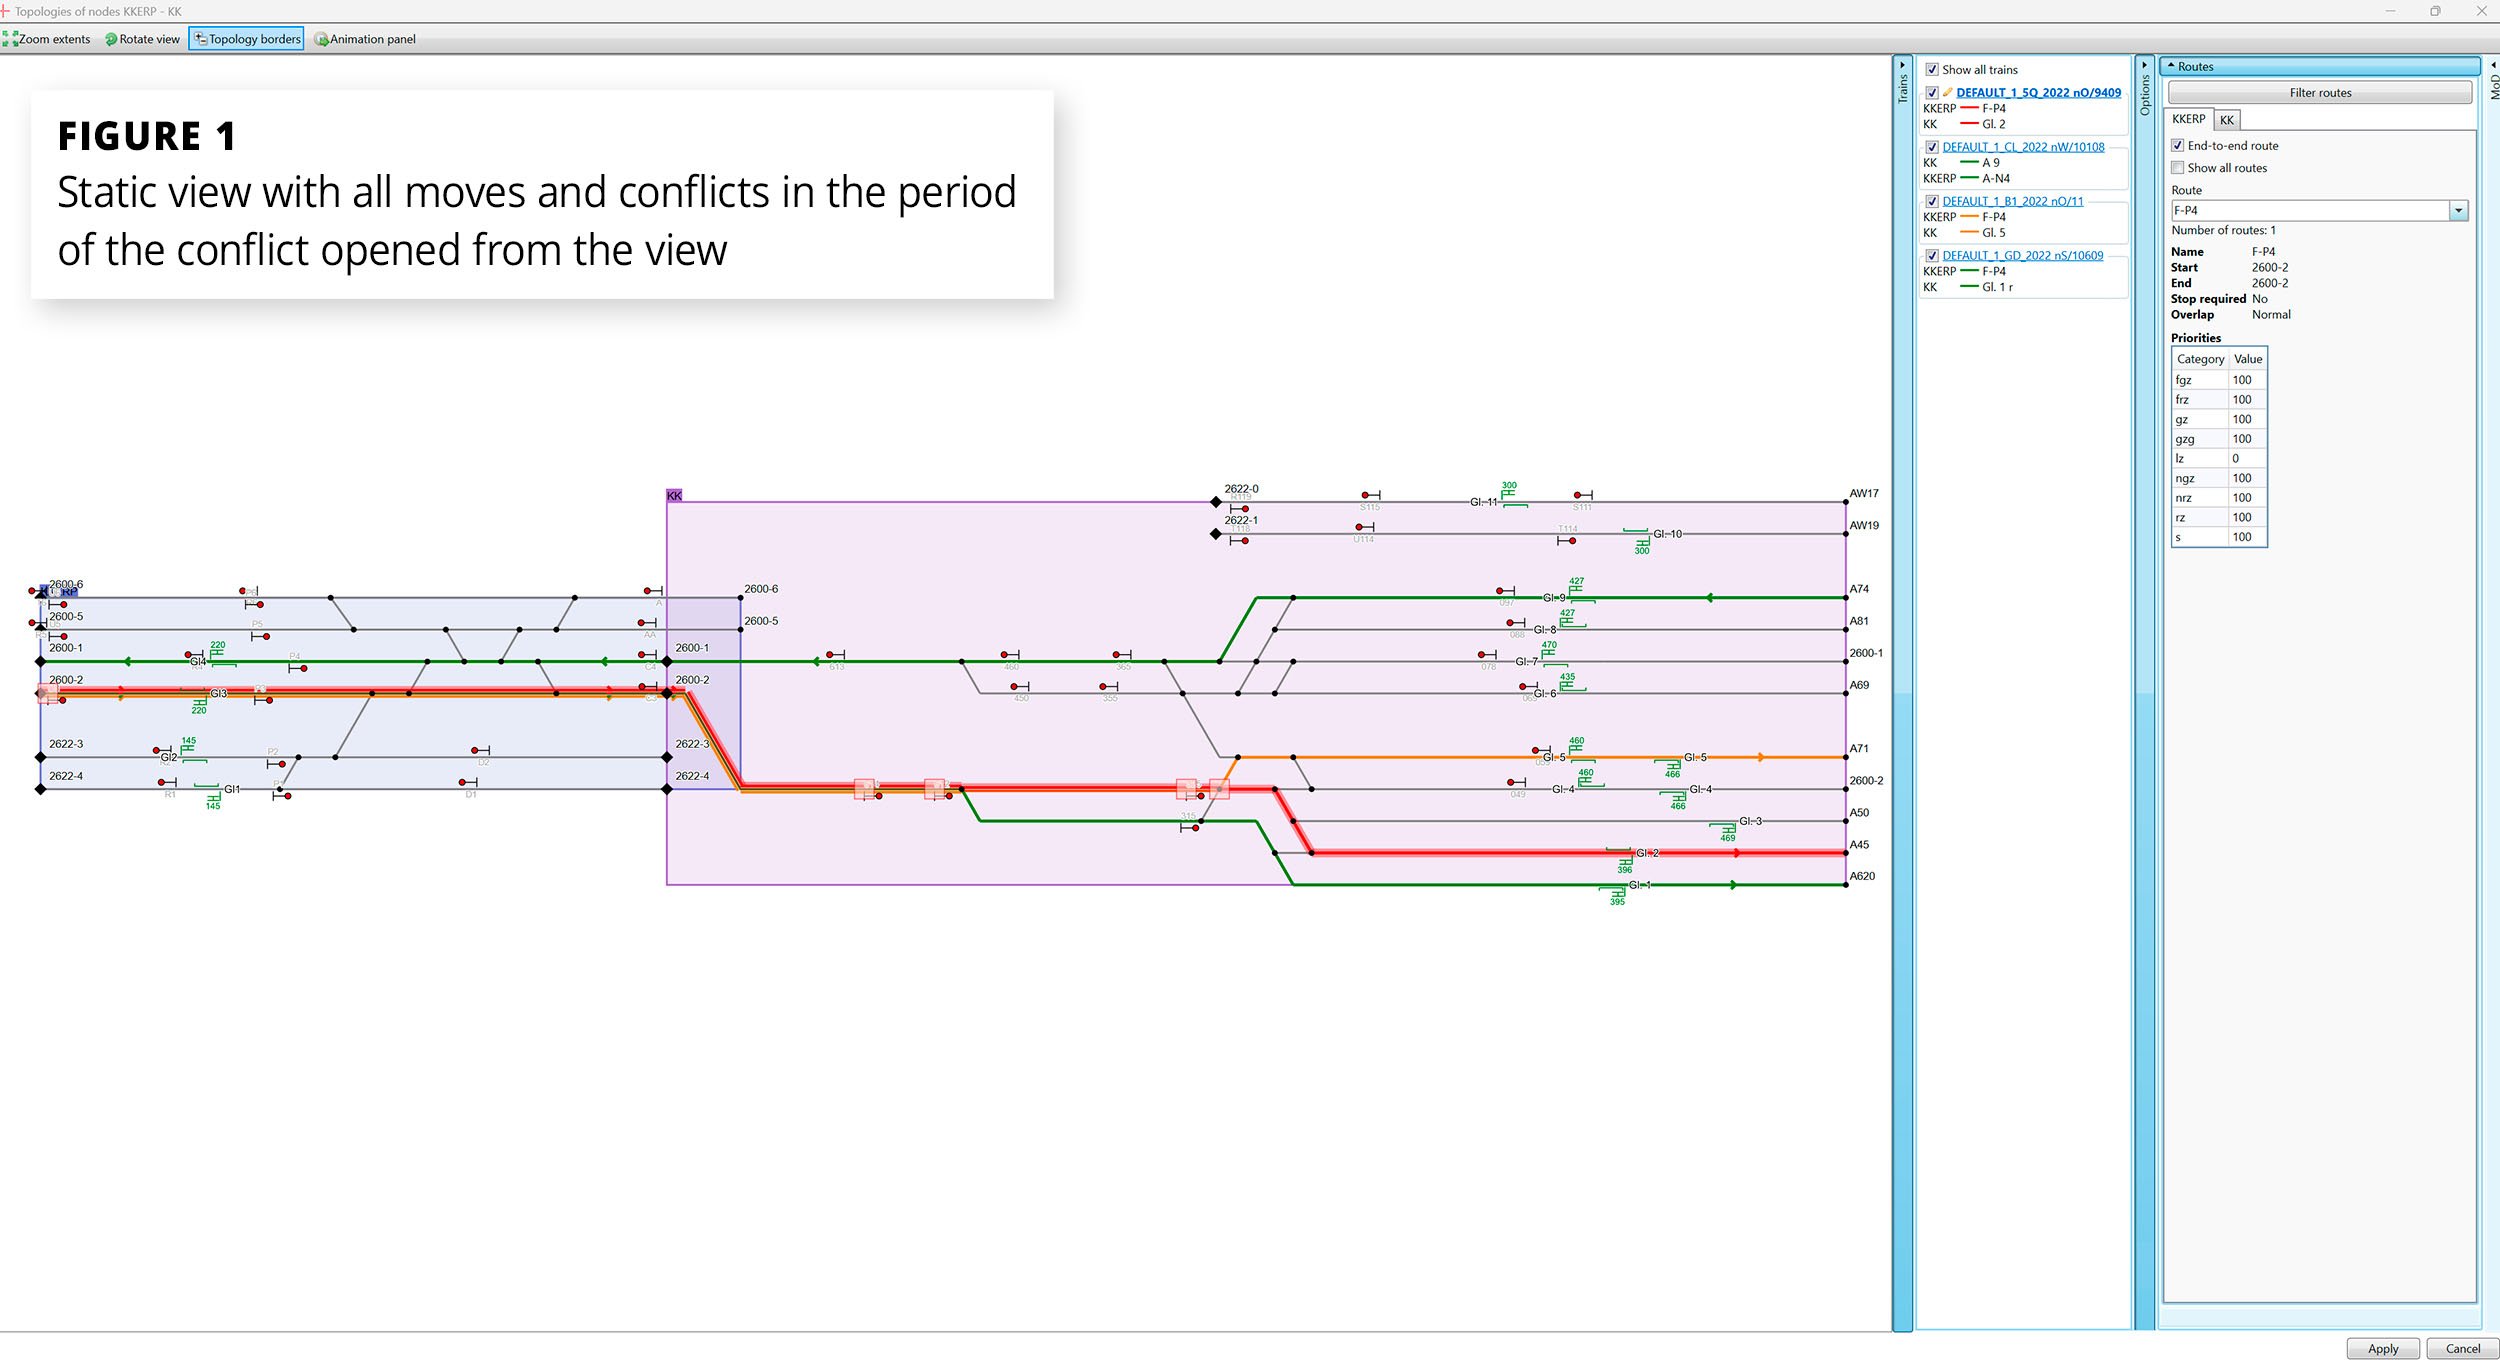
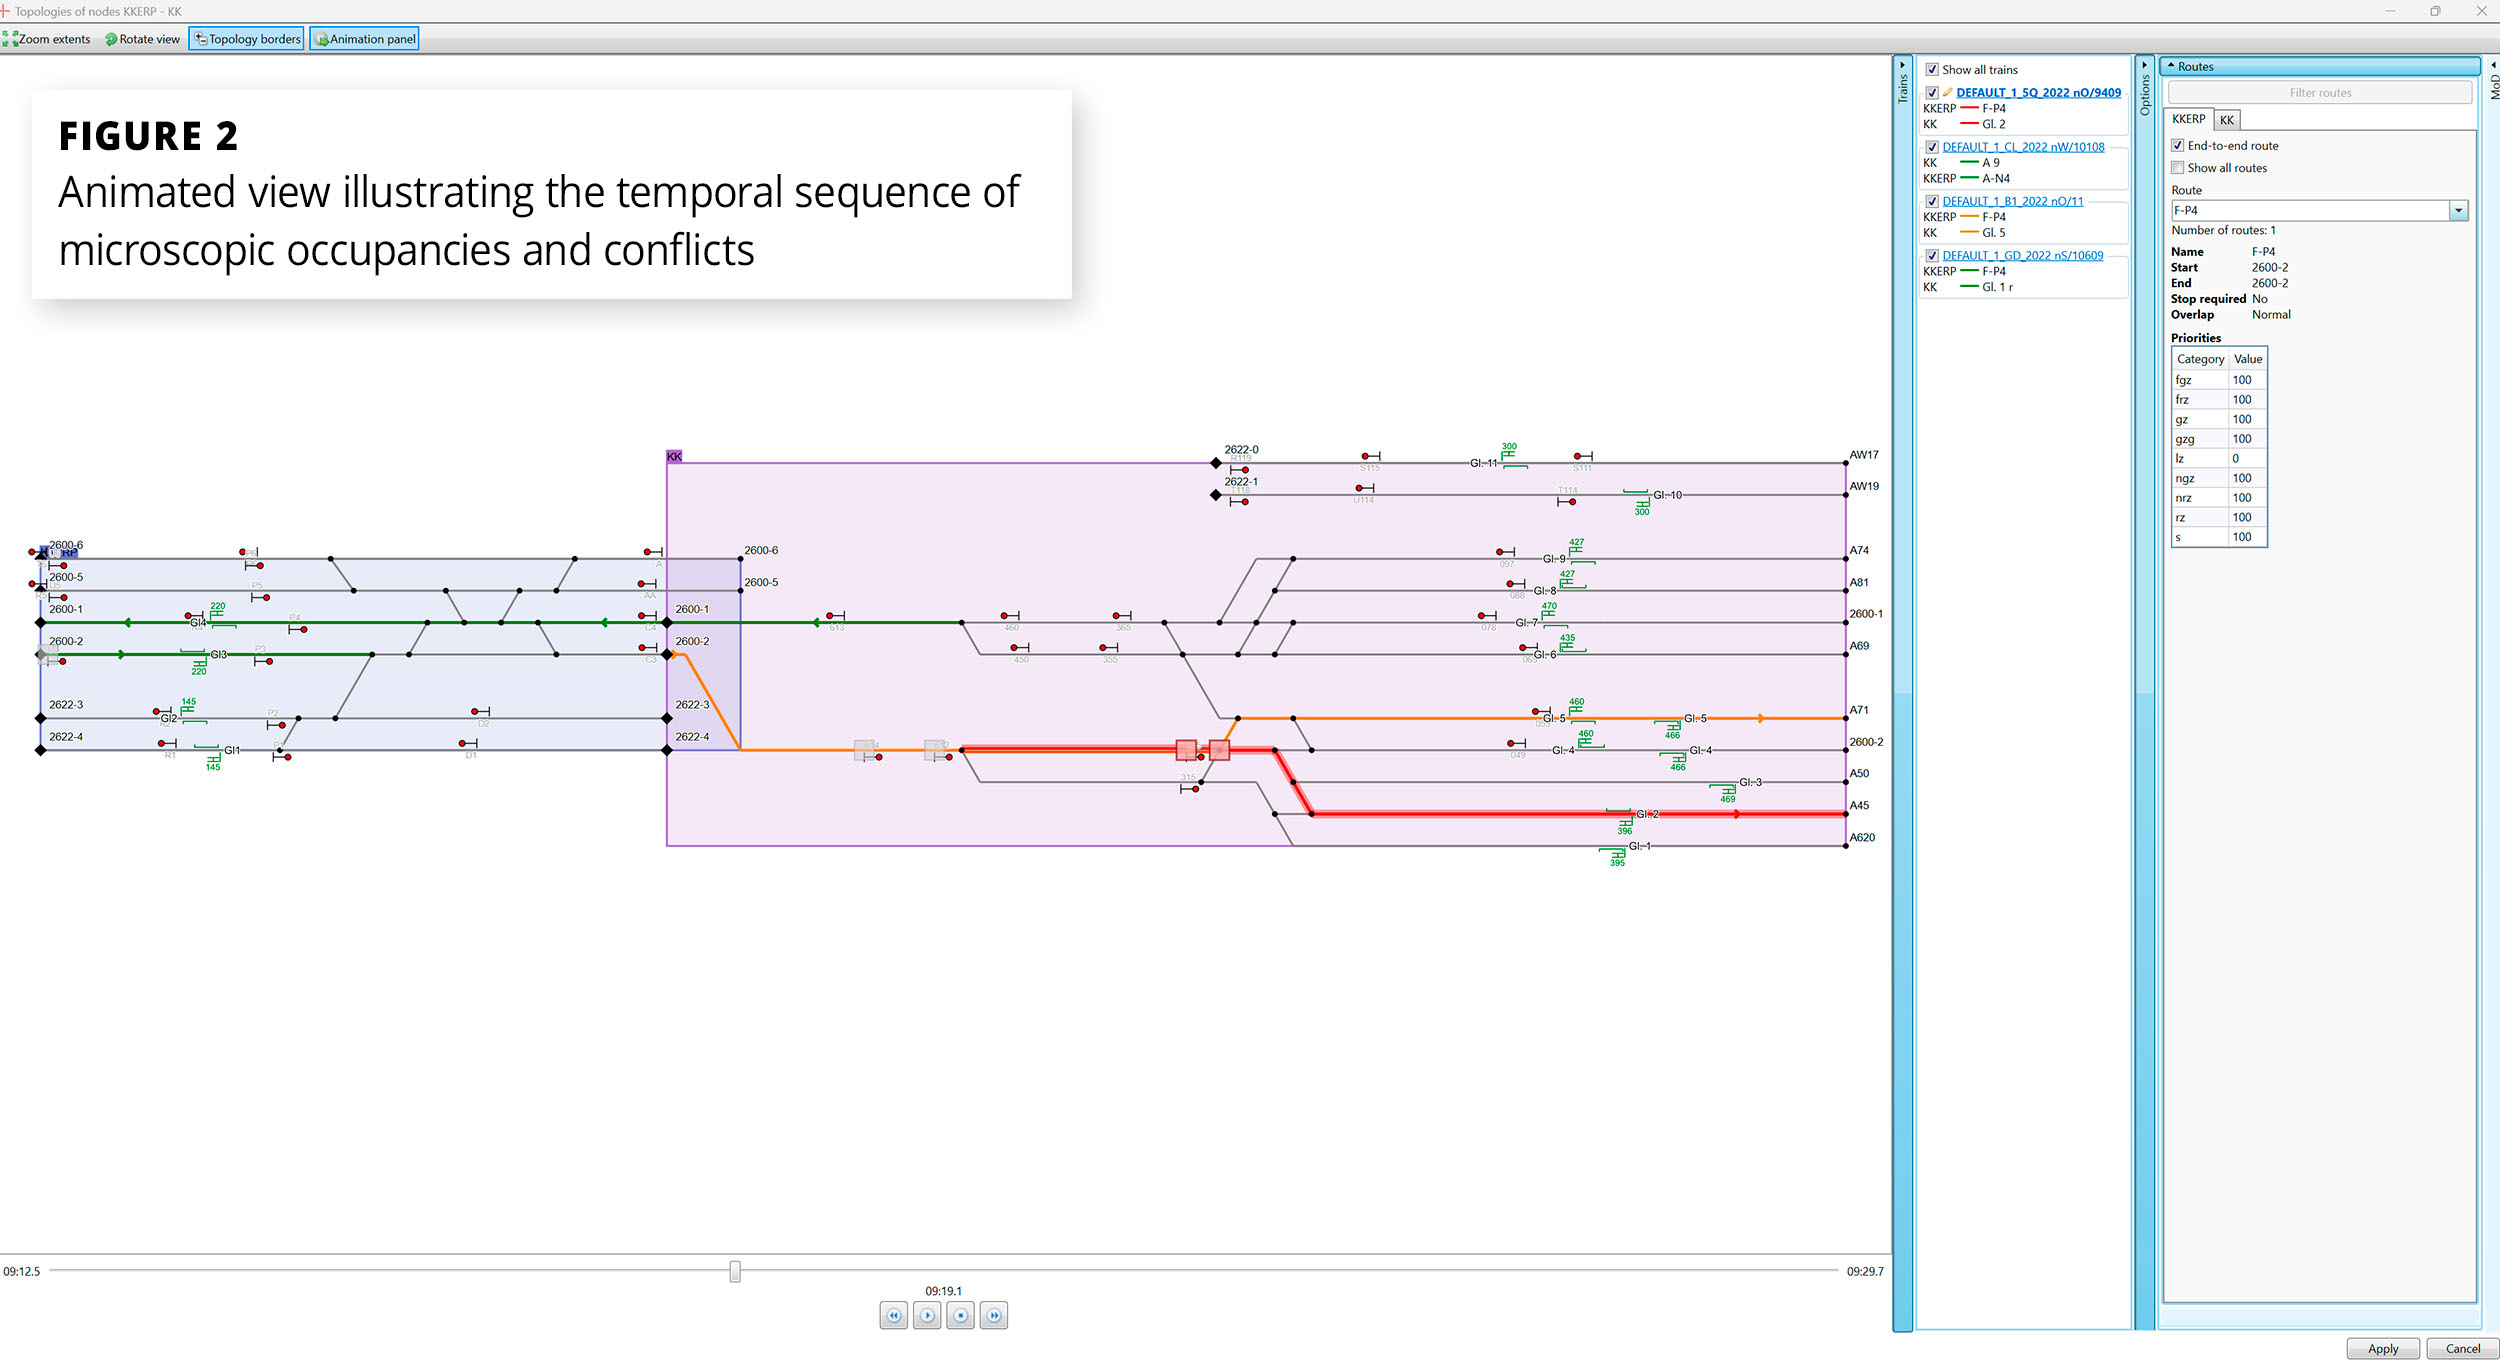
Previously, the topology viewer was used exclusively to display and select microscopic routes. Microscopic conflicts can now also be displayed in the topology viewer. The routes of all trains that are in an operating centre during the conflict period are displayed and the microscopic elements at which the conflicts occur are shown precisely. It is also possible to play back the chronological sequence of occupancy in a simulation. These functionalities allow a detailed analysis of the conflict constellation. Further improvements in the topology viewer include the graphic display of additional microscopic elements such as signals, stops, etc. and the option of opening the topology viewer across several operating centres. It was possible to implement all of these extensions without having to extend the microscopic API. This illustrates the power and expandability of the MoD architecture.
The improvements described are already being used extensively for microscopic testing in mKoK 2026ff. The numerous positive user responses to the enhancements not only confirm the suitability and effectiveness of MoD in medium-term planning, but also make it clear that the full potential of this approach is far from being exhausted.