Unlocking Viriato data: Deeper system insights through smart data analysis
A recurring question faced by users of tools such as Viriato is “how can I do more with my data, faster?”
Users have always had ways to export data to 3rd party tools for analysis and post-processing, but this was often time-consuming and a complex process, and limited to the functionality provided by the tool as supplied without being extensible. The rise of APIs (“Application Programming Interfaces”, a way to communicate with the core of a program from another software application) coupled with the general increase in programming skills amongst users and engineers, particularly using the Python programming language, either writing scripts directly or perhaps through the relatively new concept of “vibe coding” (where a user describes to an AI system what they wish to achieve through “prompts” and then much of the code is written autonomously), means that it is easier than ever to extract data from Viriato for processing in other systems.
This has a range of uses limited only by the imagination of the user. Typical examples of this workflow include graphical representations using a GIS (“Geographical Information System”) where complex and attractive visualisations can be produced showing train data on maps, business information systems where the raw data for Viriato can be mined to produce deep insights into the planned timetable, and optimisation projects where an external mathematical solver is used to produce sophisticated algorithmic solutions to complex scheduling problems. When working with the Viriato Algorithm Platform, it is possible to create an integrated workflow where a custom GUI within Viriato provides the context for the data selection, and modified trains can be written back to Viriato for further use.
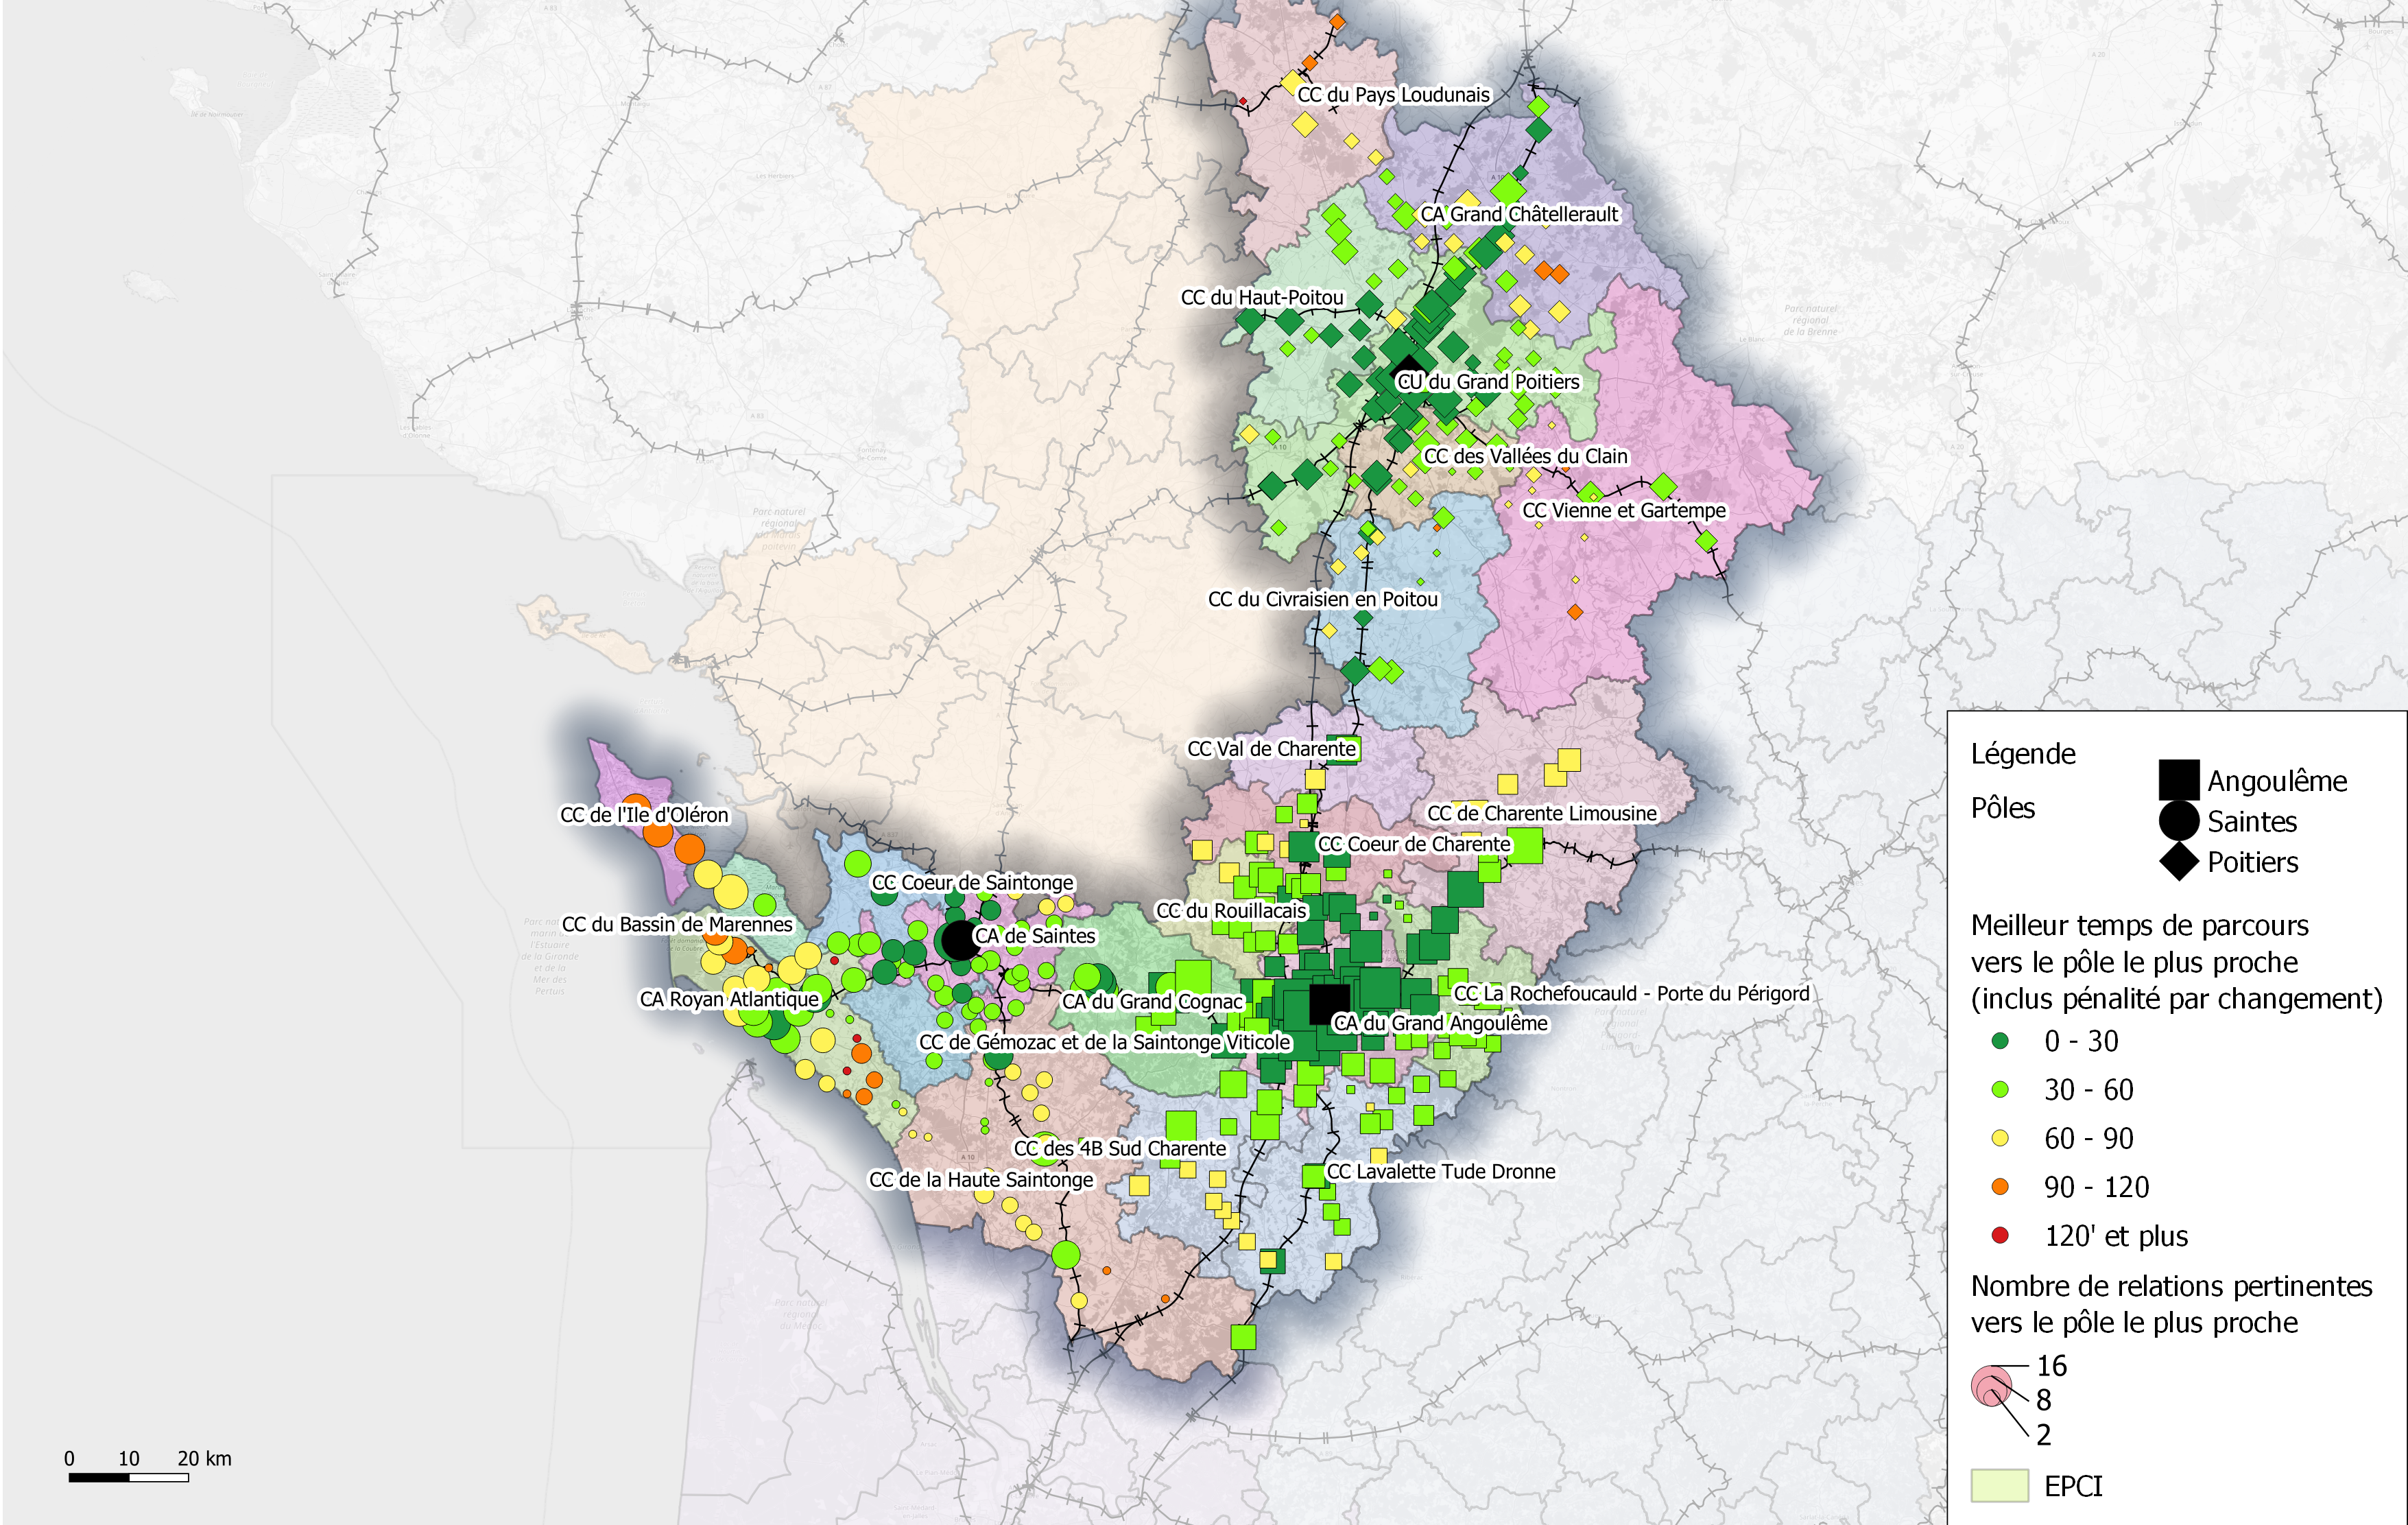
A benefit of these approaches is that it is possible to integrate data from different sources, for example Viriato and population data from national statistics providers, allowing for the creation of rich analyses and visualisations that are consistent with the planned timetables created in Viriato without having to resynthesise these for the data analysis step.
Some recent examples of this analysis and visualisation workflows taken from real-life consulting projects we have been involved in include:
- Offer quality assessment through Trip Time Analysis: Using the CSV export from the Trip Time Analysis module containing connections between station origin-destination pairs, it is possible to derive key performance indicators to compare different scenarios, including number of connections, trip times, changes, and generalised travel times. By weighting these running times according to travel mode and calculating relative improvements, this analysis can extend toward demand estimation. This export can also evaluate the nodal performance of stations by quantifying the number of possible interchange connections between different service branches.
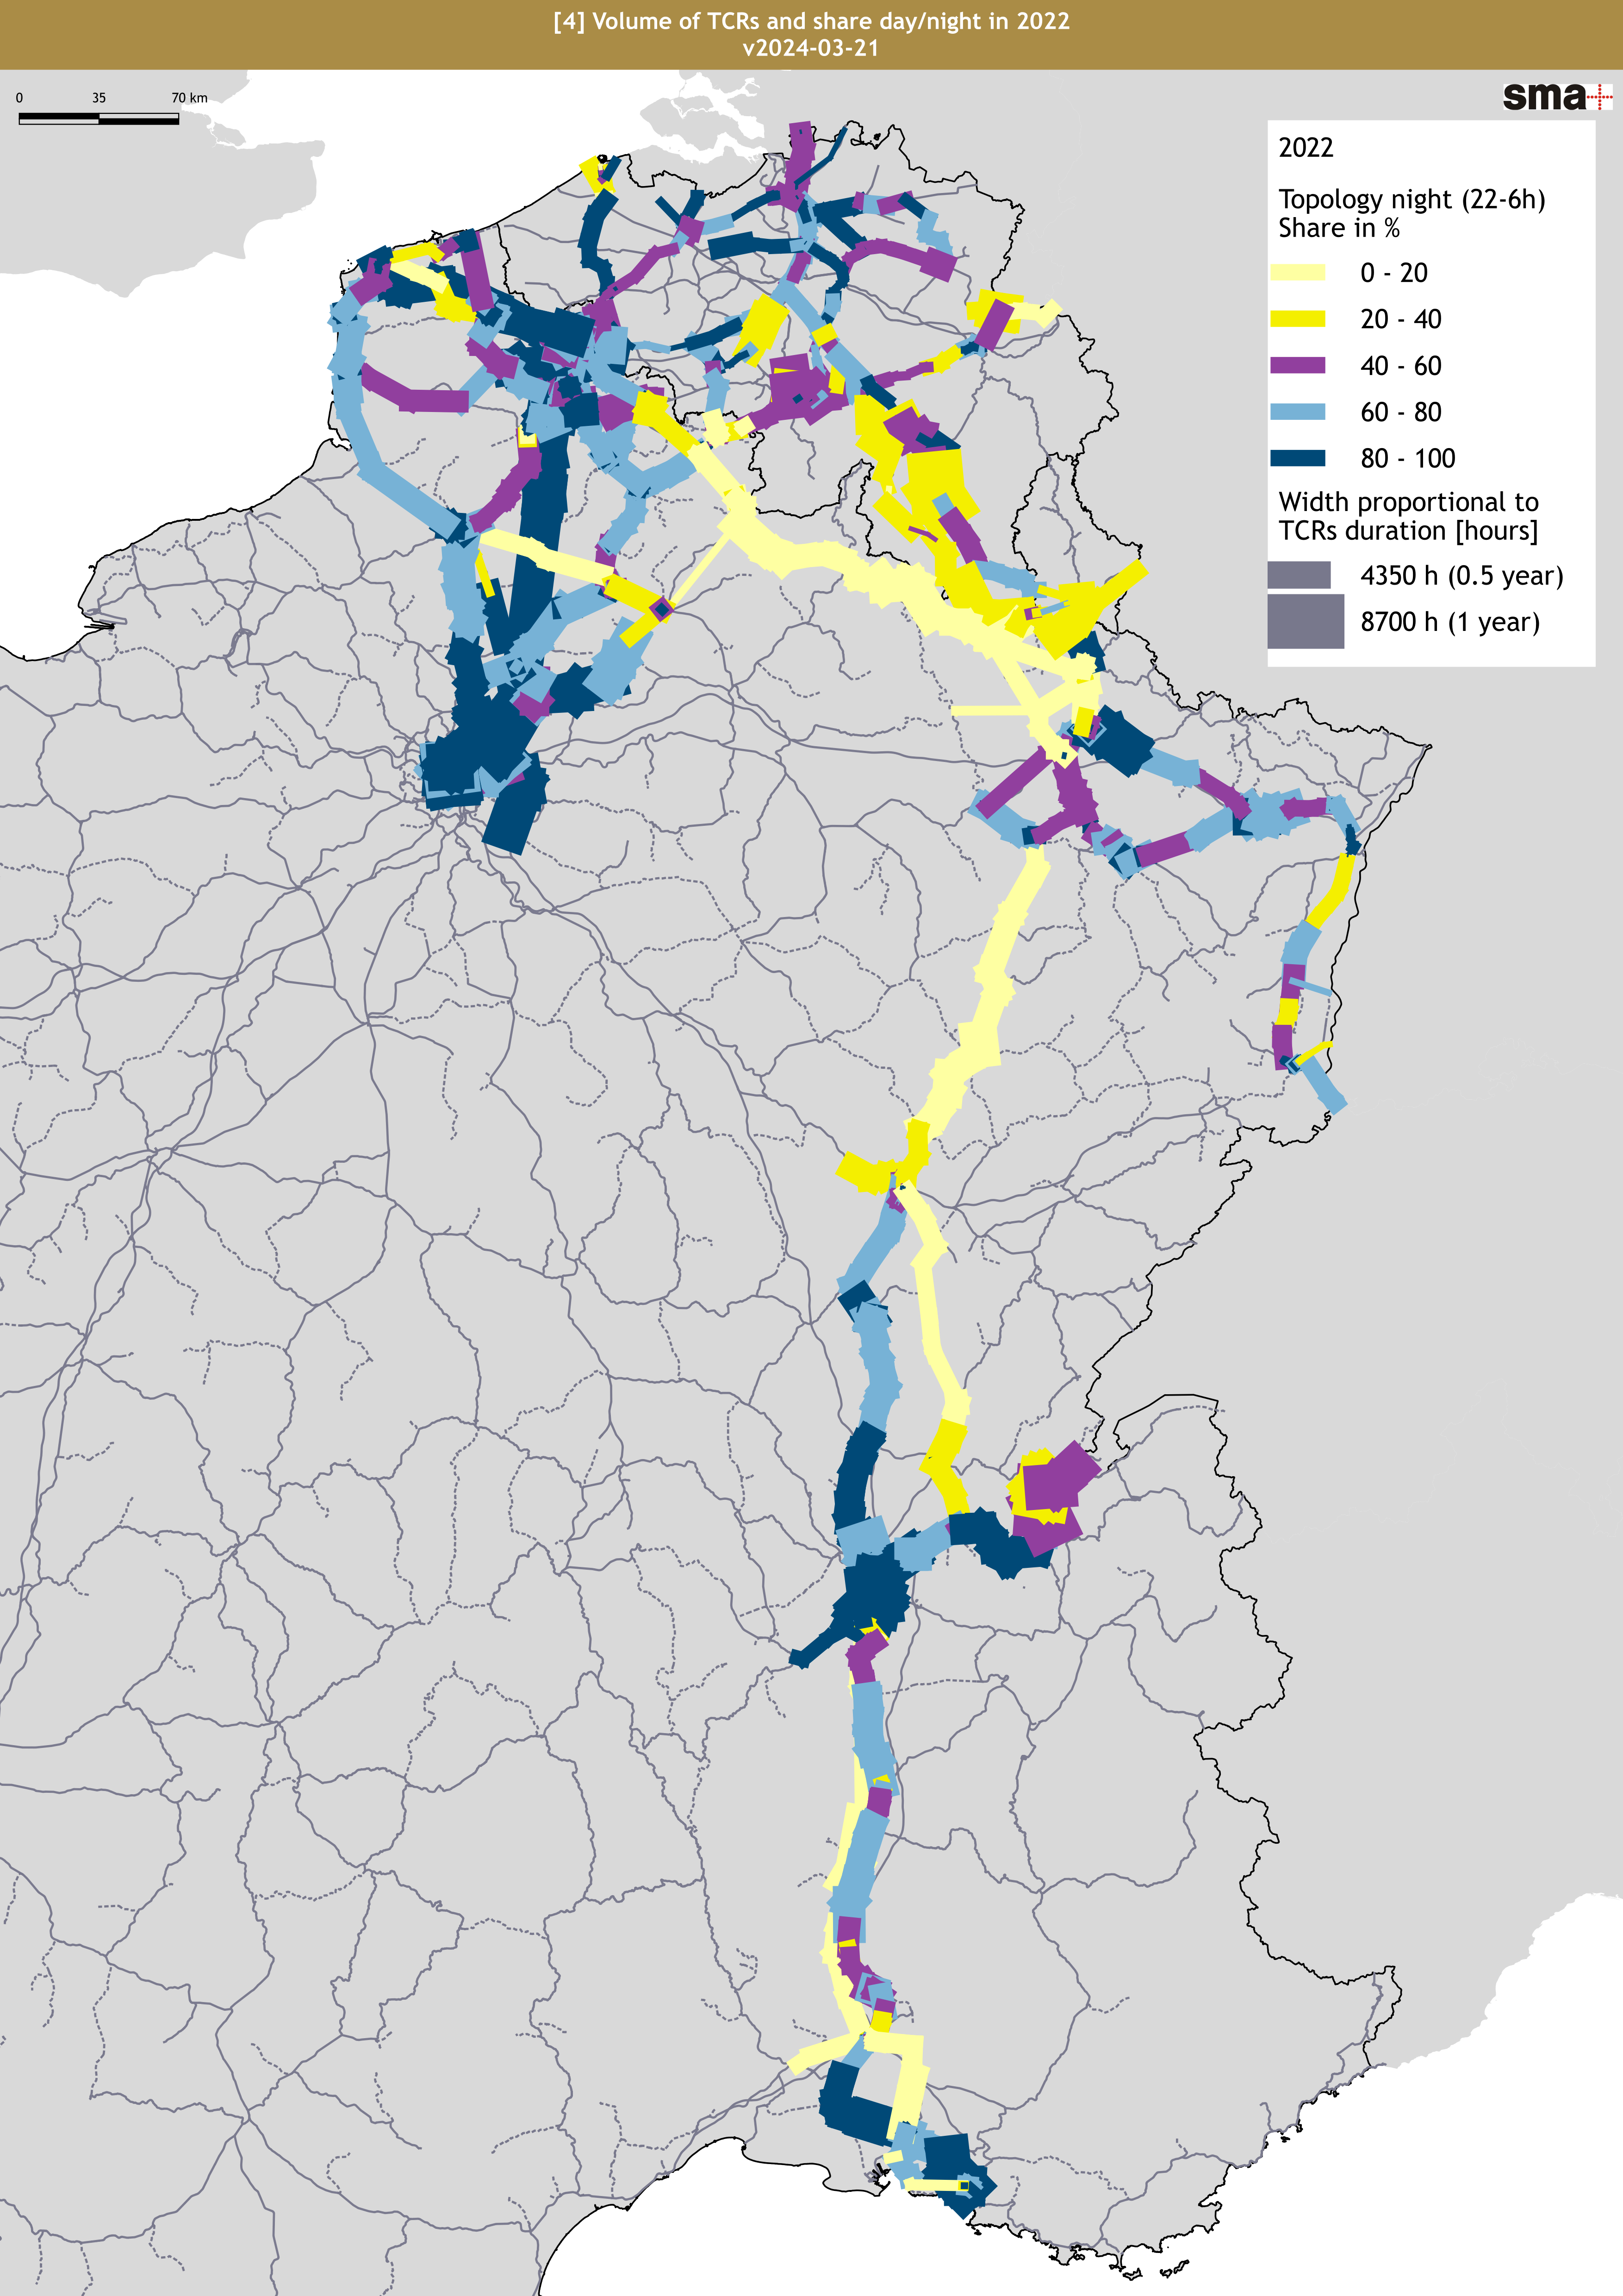
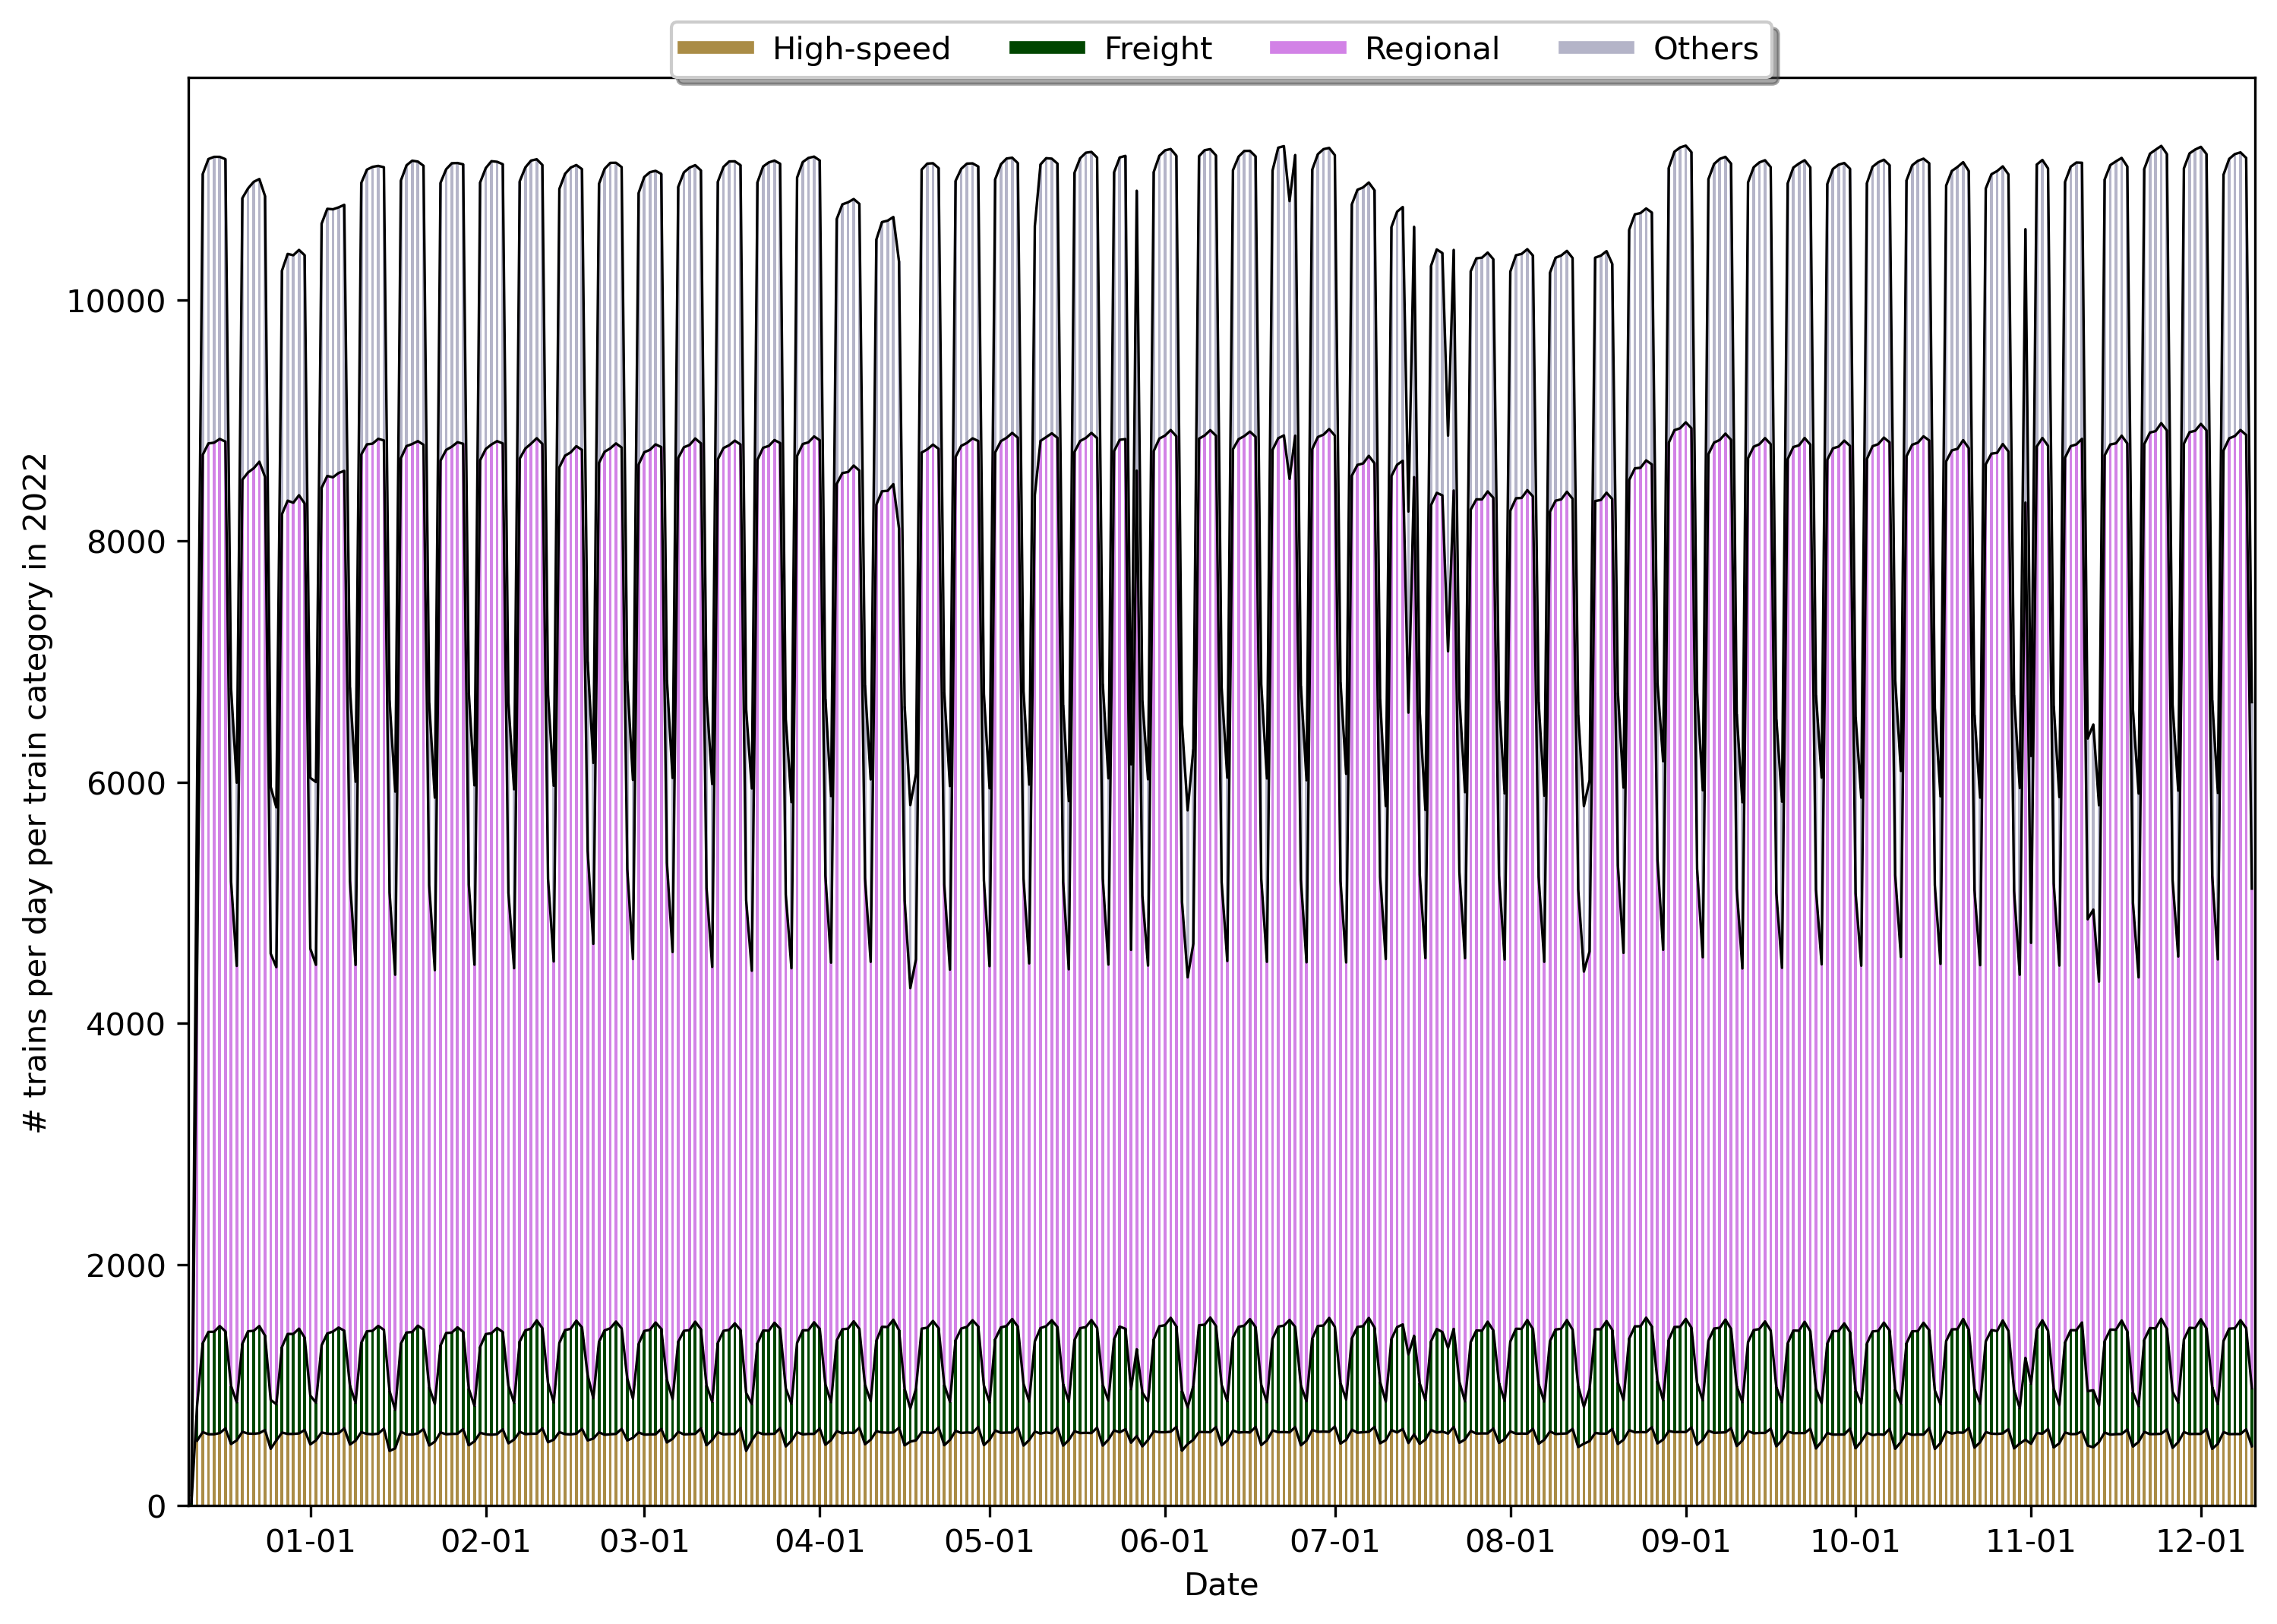
- Section-based network analysis via XML Reporting Export: Viriato's XML export interface provides a convenient pathway for undertaking detailed section-level analysis. Recent applications have included computing planning headways, analysing trip times per section, measuring running time heterogeneity, calculating trains per hour, and tracking temporal variations throughout time periods from a single day or through to the annual service plan. When combined with rolling stock seating capacity data, this workflow has enabled the production of sophisticated visualisations showing occupancy rates across the network.
- Operational personnel cost analysis: The CSV export from the Viriato Vehicle Rostering module provides a comprehensive list of activities for each timetable. Building upon this foundation, an analysis toolkit has been built where the vehicle rostering module is used for generating macroscopic crew schedules, and then these schedules are exported to the external script which validates that the operational constraints for working times, driver breaks and depot stabling are met, enabling an efficient process where the number of personnel required can be determined, their indicative schedules optimised, and accurate operational cost projections to be made.
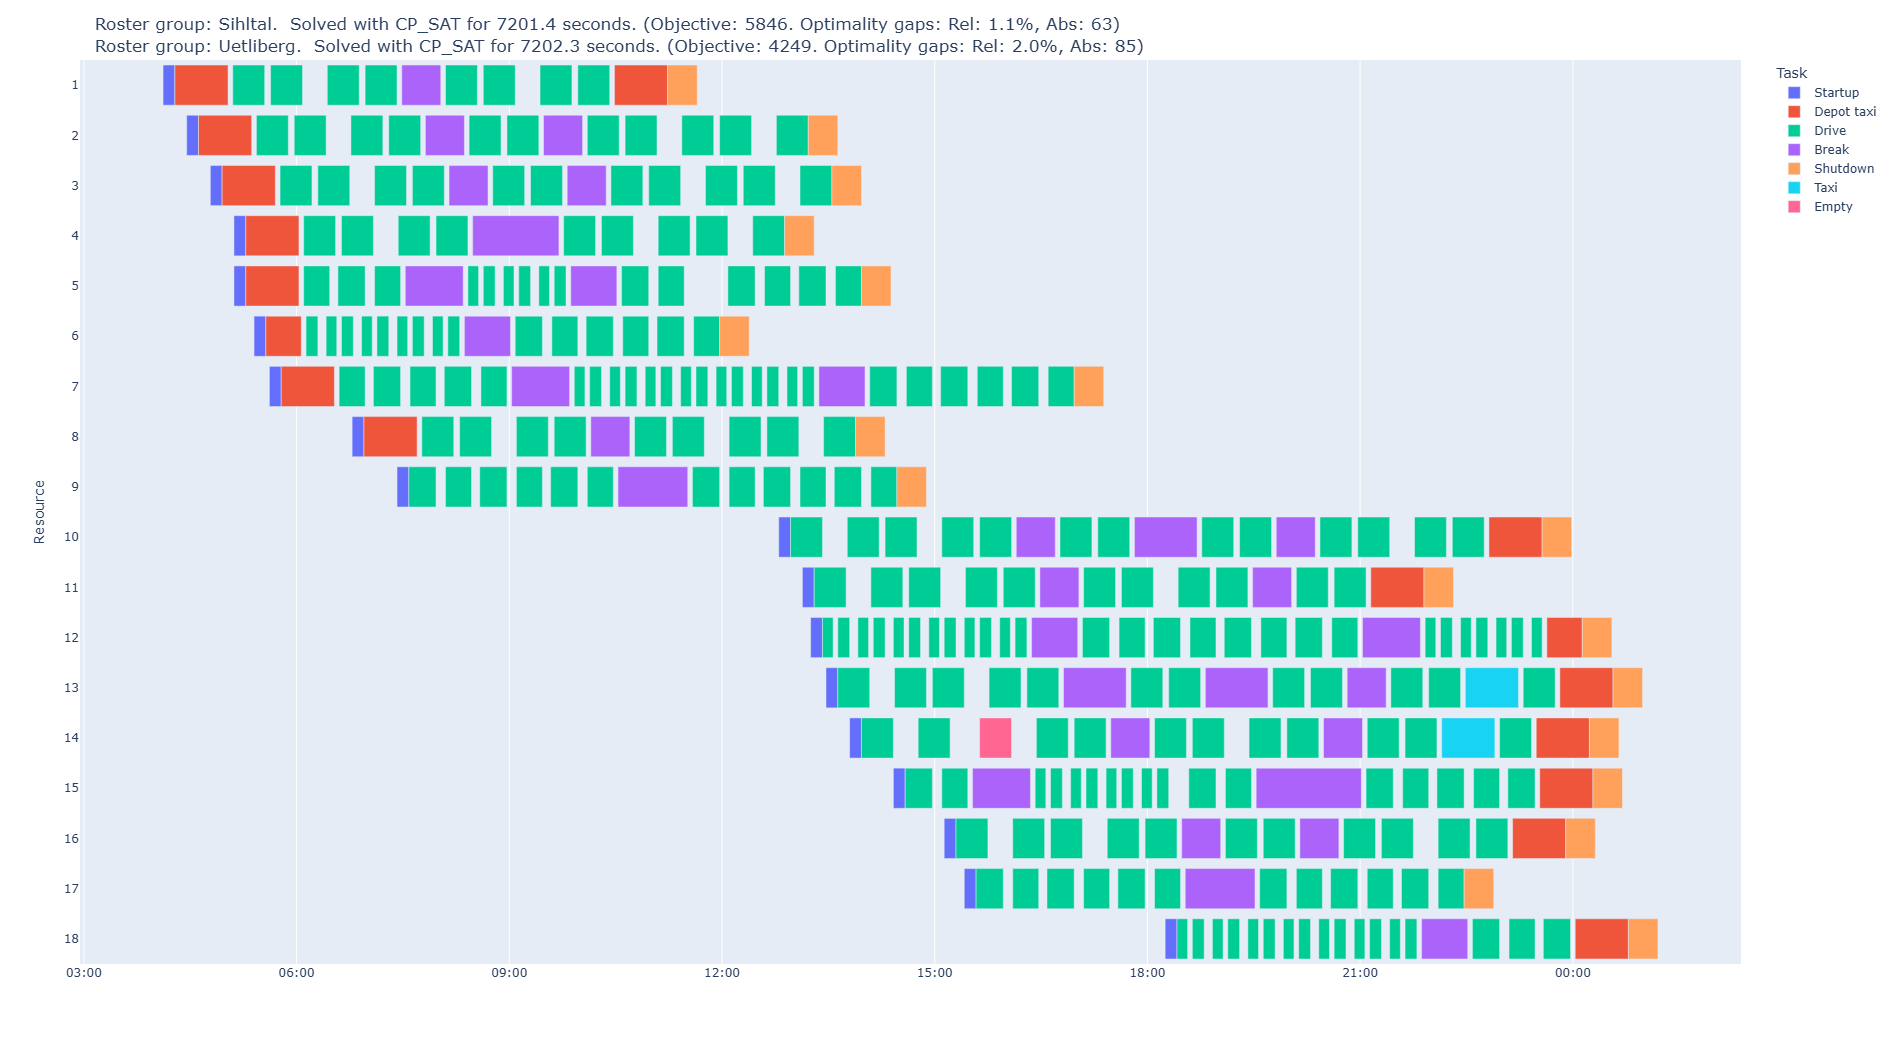
- Crew scheduling optimisation: An internal study to determine if the crew schedule rosters could be generated automatically using a solver. The base crew work activities were derived from train activities extracted programmatically using the Viriato Algorithm Platform and then passed to an optimisation algorithm to generate crew schedules reflecting rules including maximum shift lengths, working time without breaks, empty runs and taxis, etc. The results can then be visualised in the form of Gantt charts and tables.
- Robustness analysis through Monte Carlo simulation: Viriato's stochastic robustness analysis tool produces CSV outputs that can be processed through external scripting tools. A Python-based pipeline has been developed to compute reliability and availability indicators from these simulation results and to visualise the findings in graphical timetable formats, providing clear insights into timetable stability under various operational scenarios.

These examples show how it is possible to develop novel, customer specific analyses using data sourced from Viriato and transforming it with a range of tools and techniques into useful outputs.
SMA already uses these methods to provide solutions for our customers in consulting projects, where it is important to provide an informative, but accurate, visualisation of the results we are presenting based on the timetables generated during the study, and we encourage and support users of Viriato to investigate with us how the data generated in the tool can be used to produce further insights.